


Image: METAL
Summary
- Google Research on October 6 released results from applying Google Earth AI's Population Dynamics Foundation Model (PDFM) to five public health tasks, alongside a 41-page paper.
- Explained variance in MMR vaccination coverage along the US-Canada border rose from 16% to 22%, and eight-week cholera forecasts in the Democratic Republic of the Congo picked 18% more true outbreak zones.
- The paper also states that in postpartum depression prediction the model does not replace individual income and insurance data.
Google Research on October 6 published the results of five case studies applying Google Earth AI's Population Dynamics Foundation Model (PDFM) to public health work. Across five tasks covering measles vaccination coverage, cardiovascular deaths, dengue, postpartum depression and cholera, plugging the model's location embeddings into existing epidemiological models matched or improved performance. The evaluations were run separately by Mount Sinai Health System and Boston Children's Hospital, NYU Grossman School of Medicine, the University of Oxford and Tecnológico de Monterrey, the University of Washington, and the World Health Organization Regional Office for Africa (WHO AFRO). The work spans four countries: the United States, Canada, Mexico and the Democratic Republic of the Congo.
PDFM produces a bundle of numbers for each place, a kind of fingerprint for a location. It compresses anonymized search trends, mobility and built-environment signals such as how busy pharmacies, clinics and parks are, and high-resolution weather and air quality metrics through self-supervised learning. The fingerprints are refreshed monthly. The researchers used the embeddings only as fixed inputs, without task-specific fine-tuning. The statistical and machine learning models epidemiologists already use stayed in place, with one more input variable added.
The cross-border effect showed first. In 146 US counties within 150 kilometers of the Canadian border, models using only domestic data struggled to predict vaccine uptake. Researchers at Mount Sinai and Boston Children's Hospital added Canadian postal-area embeddings to the US county embeddings to capture mobility and information flows across the border. The share of variation in measles, mumps and rubella (MMR) coverage explained by the models rose from 16% to 22%, a 36% increase, and coverage estimates shifted by at least 3 percentage points for 4.7 million border residents. According to the paper, about 18.6 million people live in these border counties, and national kindergarten MMR coverage has fallen to 92.7%.
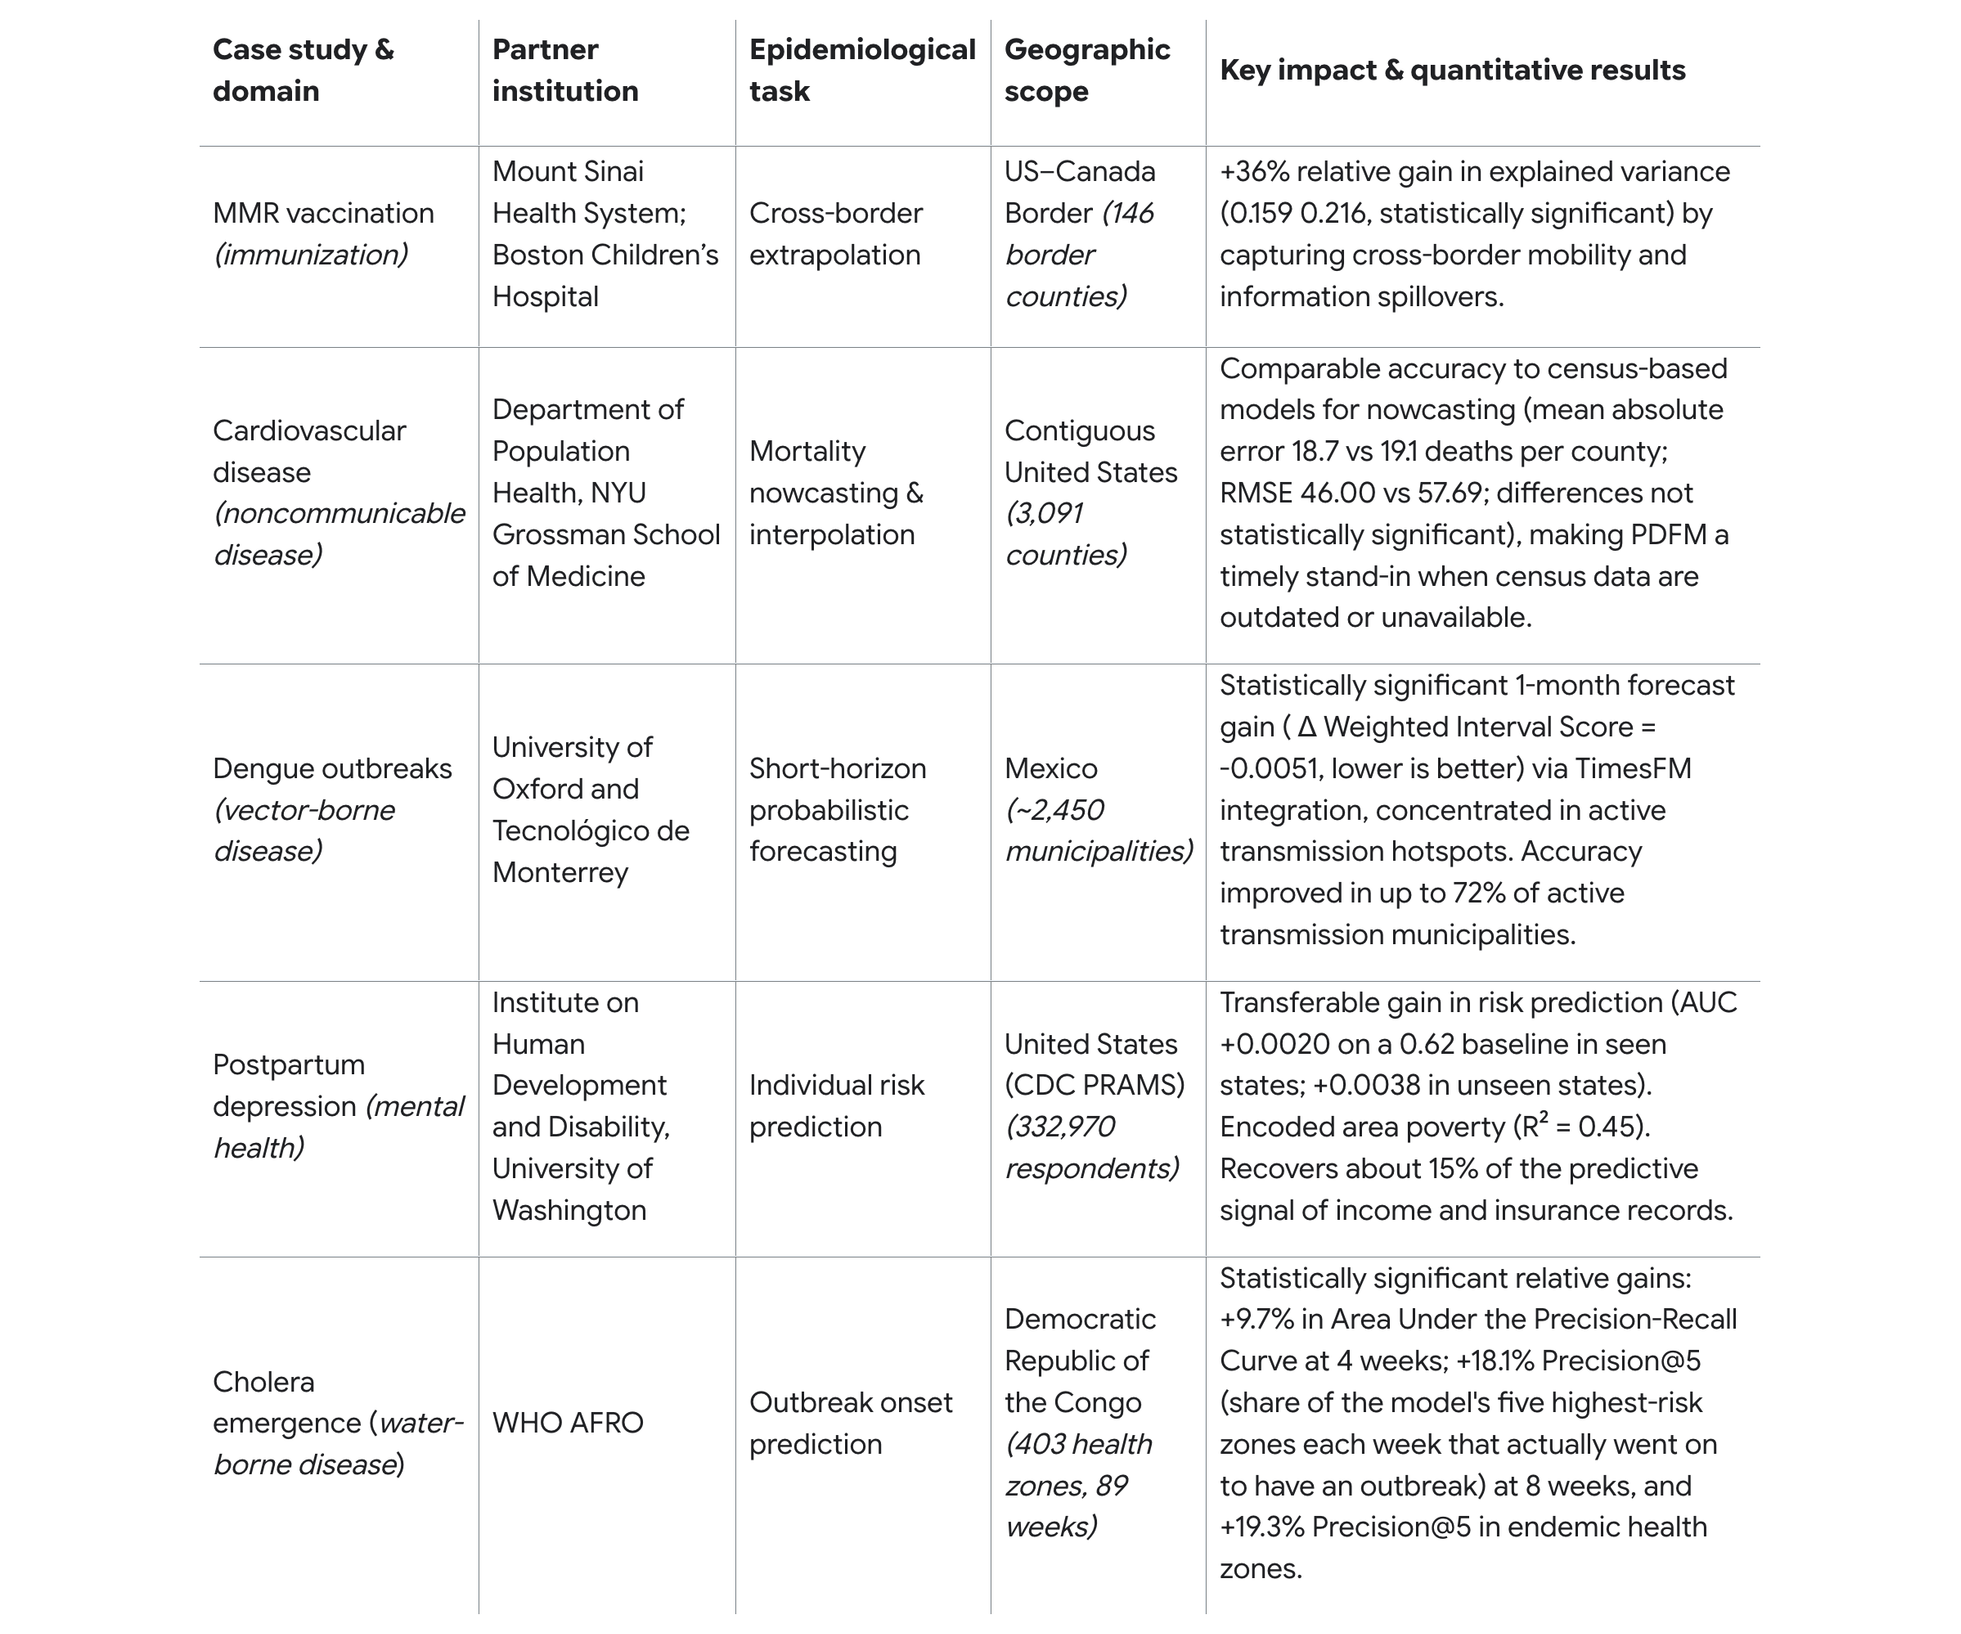
The cardiovascular analysis targeted gaps in statistics. More than 916,000 people die of cardiovascular disease in the US each year, yet official county-level mortality data lag by one to two years and census-based covariates by two to three years. Researchers at NYU Grossman School of Medicine used PDFM to estimate 2023 deaths across 3,091 counties in the contiguous US. The average error was 18.7 deaths per county, statistically no different from 19.1 for a model using American Community Survey (ACS) data, while RMSE, the measure driven by large errors, fell 20% from 57.7 to 46.0. ACS pools five years of surveys and is released up to a year later, whereas the embeddings in this study were built from one month of data. PDFM is available in 17 countries.
Infectious disease forecasting paired PDFM with TimesFM 2.0, Google's time-series foundation model. Researchers at Oxford and Tecnológico de Monterrey forecast dengue cases across about 2,450 Mexican municipalities from 2020 to 2025. The gains were largest one month ahead, with accuracy improving in up to 72% of municipalities with active transmission. Total error reductions were 3.4 times larger than total degradations.
Cholera is hard because it is rare. In any given week, fewer than 1 in 100 of the Democratic Republic of the Congo's 403 health zones sees an outbreak begin. The researchers attached a lightweight PDFM, adapted for regions with sparse internet connectivity, to 89 weeks of surveillance data. One or two weeks out, recent case counts explained most of the signal and PDFM added no significant gain. Eight weeks out, when there is still time to move vaccines and clean water, the number of the model's top five picks that went on to have an outbreak rose from 1.78 to 2.10 per week, an 18% improvement. In 15 endemic zones that reported cholera in at least half of all weeks, precision rose from 0.3333 to 0.3975, a 19% gain.
Individual-level prediction showed both use and boundaries. University of Washington researchers predicted postpartum depression risk among 332,970 respondents to the CDC's Pregnancy Risk Assessment Monitoring System (PRAMS). Adding the embeddings raised AUC by 0.0020 in states seen during training and 0.0038 in unseen states, and captured area poverty with an R² of 0.45. That recovers about 15% of the predictive signal in income and insurance records. In a simulation that follows up the 20% highest-risk mothers, the model reached 5,640 more rural mothers with postpartum depression each year, and in a setting that aims to catch 80% of cases it cut 17,723 false alarms annually. The paper states that this signal does not replace individual socioeconomic data or close demographic screening gaps.
Google also described field deployments the same day. Shravya Shetty, Distinguished Software Engineer at Google Research, and Monica Bharel, Clinical Specialist at Google Health, wrote on the company blog that "a community's health is deeply connected to its geography." According to them, during the ongoing Ebola outbreak in the Democratic Republic of the Congo, the WHO AFRO team used a research prototype Geospatial Reasoning agent to map mining corridors and pinpointed 48 exposed settlements and more than 45,500 at-risk people within minutes. The task would normally take weeks, and responders used the results to deploy mobile laboratories and coordinate border surveillance. Google.org provided funding to the DRC's National Institute of Biomedical Research (INRB) to modernize testing and disease surveillance.
The 41-page paper METAL reviewed lists 38 authors and contains 7 figures and 12 tables. Arbaaz Muslim and Gautam Prasad, software engineers at Google Research who wrote the blog post, argued that "geospatial foundation models enable moving from reactive, localized modeling to proactive and time-sensitive health intelligence at planetary scale." The researchers said that because current embeddings are static snapshots, they are working on temporally dynamic embeddings and geographic transfer learning for under-connected regions.
A commercial path is open as well. PDFM embeddings are available in Preview as Population Dynamics Insights, a geospatial embeddings dataset from Google Maps Platform, and academics and public health researchers can request no-cost access for select non-operational research. METAL previously reported that a Google Research AI model took first place in a CDC flu forecasting evaluation. Following flu, these case studies show Google pairing disease forecasting models with place embeddings to widen its role as a supplier of public health data.
The weight of this release lies less in a new model than in how it is used. In all five cases, researchers added one input without rebuilding their models, and the gains were largest where statistics are late, stop at borders or are missing altogether. At the same time, individual screening drew a line: place information cannot stand in for personal information. Whether health agencies adopt these fingerprints will come down to how early and how accurately they raise alarms when combined with local data.
Sources
- Google Research — Unlocking Earth AI’s planetary geospatial foundation models for global public health →
- Google Research (X) — Google Research on X — five partner-driven case studies →
- arXiv — Planetary Geospatial Foundation Models: A New Paradigm for Global Public Health →
- Google — Making global public health more proactive with Google Earth AI →


Comments